
The Android app now uses native OpenGL based graphing code to handle large amount of data points (e.g. plotting data from up to 255 tags on the same screen) and to allow smooth zooming/panning by touch gestures. Also the same code for iOS app graphing has been ported to Android for dynamic download of raw data points from cloud as graph is zoomed or panned, so even if millions of data points are captured, the graph will load instantly.
You are able to download the entire data as CSV file using the download button at upper right corner (to email, Google Drive, Drop box etc) or share the displayed graph as PNG file using installed photo sharing apps (Email, facebook, picasa etc) using the share button.
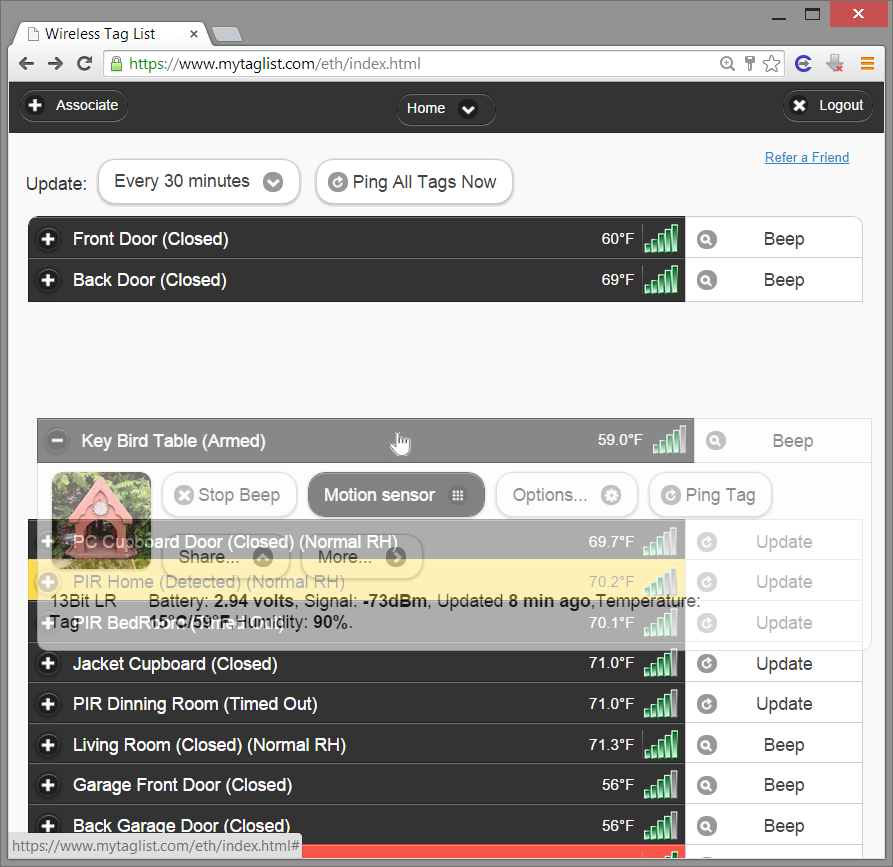
If you are mainly using the Web interface with mouse (on Mac or PC), you can now drag & drop each tag entry to change the order they are displayed. The sorting you did is automatically remembered by the cloud and be synchronized across devices (e.g. the tag list on the iOS device will appear in the same order).
Comments